Measuring the performance of your manufacturing operations is a complex task. It requires time, energy, and careful monitoring and reporting of key performance indicators (KPIs). Among the measurable metrics, manufacturing KPIs stand out as crucial benchmarks, providing crucial insight into your business operations.
In this blog post, you’ll learn more about manufacturing KPIs, why metric measurements are important, and how using the best reporting tools can provide detailed analytics to enable better decision-making for your company’s future.
Performance Indicators That Matter
Key performance indicators are measurable metrics that reflect the performance of specific aspects of a company. KPIs consist of four broadly categorized areas no matter what type of business you operate. They are:
-
- Strategic: KPIs align with overarching business goals
- Operational: KPIs track the efficiency and effectiveness of production processes
- Functional: KPIs offer insights into quality control, inventory management, and maintenance
- Leading and Lagging: Leading KPIs anticipate future performance trends, providing early warning signals and opportunities for proactive intervention. Lagging indicators reflect historical performance outcomes, offering insights into past successes or failures.
Top Manufacturing KPIs
Manufacturing KPIs strive to gauge and oversee operational and functional effectiveness throughout the organization. Custom manufacturers take significant interest in these indicators because they are process-oriented and directly affect profits. UpKeep notes the following top indicators that manufacturers should track.
Overall Equipment Effectiveness (OEE)
OEE is a manufacturing KPI that evaluates if manufacturing equipment is being utilized effectively. It combines three key factors: availability, performance, and quality, to provide a comprehensive view of equipment efficiency. OEE is typically expressed as a percentage. It can help identify areas for improvement in the manufacturing process.
- Example: A manufacturer builds custom kitchen cabinets with intricate door designs. Calculate the OEE for the specific production line that cuts the door design as follows:
- OEE = (Availability) x (Performance) x (Quality) Where:
- Availability = (Operating Time – Downtime) / Operating Time
- Performance = (Actual Production Rate / Ideal Production Rate)
- Quality = (Good Parts Produced / Total Parts Produced)
- OEE = (Availability) x (Performance) x (Quality) Where:
 Downtime
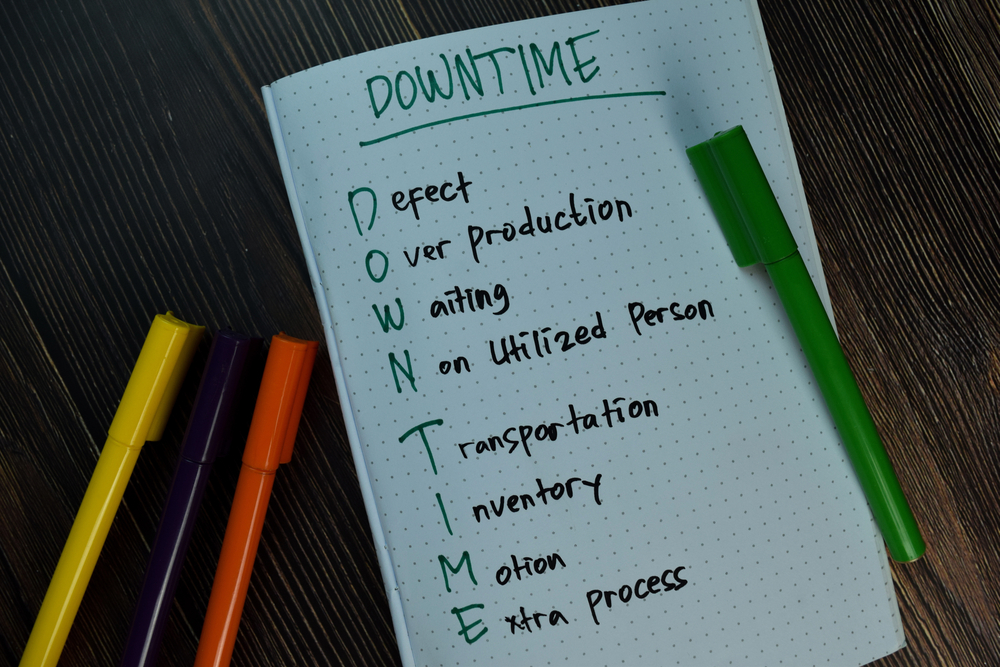 Downtime
Downtime refers to the period during which a machine or equipment is not running. This may be because of maintenance, breakdowns, changeovers, or other unplanned events. Downtime has a significant impact on production volumes since equipment could be down for minutes, hours, or days.
- Example: An aluminum blind cutter breaks down delaying a custom window treatment order. Downtime is the total time it takes to repair the cutter to continue production.
Yield, Cost, and Throughput
Yield, cost, and throughput are performance indicators related to production efficiency and effectiveness.
Yield: Yield measures the percentage of usable products manufactured compared to the total amount of raw materials used. It indicates the efficiency of the production process in converting inputs into outputs.
- Example: A furniture manufacturer produces 100 custom coffee tables, but only 90 tables meet the quality standards. The yield would be calculated as 90/100 = 90%.
Cost: Cost metrics evaluate the expenses associated with production, including materials, labor, overhead, and other resources. Cost per unit or cost per production batch are common manufacturing KPIs used to assess manufacturing costs.
- Example: Raw materials, labor, and overhead expenses incurred during production are included in the manufacturing cost per frosted window.
Throughput: Throughput measures the rate at which a system or process produces output. It indicates the volume of work completed over a specific period.
- Example: A metal fabricator’s finishing department processes 100 units per hour. The throughput of the department is 100 units per hour.
Customer Rejects
Products that do not meet customer specifications are considered customer rejects. This includes items that do not meet quality standards and are returned or rejected by the dealer or customer. Customer rejections and production errors can negatively impact customer satisfaction, brand reputation, and profitability.
- Example: A customer returns their custom-printed coffee mugs because the logo color is incorrect. These returned products are considered customer rejects.
Lead Time to Customer
Lead time to customer measures the time it takes from receiving an order to delivering the finished product. It includes processing time, production time, transportation time, and any delays encountered during the fulfillment process.
- Example: A lighting manufacturer receives an order for 24 custom LED wall sconces. It takes five days to manufacture and deliver the sconces to the customer. The lead time to the customer is five days.
Inventory Turns
Also known as inventory turnover, inventory turns measure how efficiently a company manages its inventory. Monitoring the speed of inventory turnover is crucial for businesses looking to improve their manufacturing KPIs. This data can provide valuable insights into the efficiency of a company’s inventory management practices.
- Example: A company utilizes $1,000,000 worth of inventory in a year, and its average inventory value is $200,000. The inventory turnover ratio would be calculated as $1,000,000 / $200,000 = 5. This means the company’s inventory turns over 5 times per year.
Maintenance Metrics
Maintenance metrics evaluate the effectiveness and efficiency of maintenance activities performed on equipment or machinery to ensure optimal performance, reliability, and longevity.
- Example metrics include:
- Mean Time Between Failures (MTBF): Measures the average time elapsed between equipment failures.
- Mean Time to Repair (MTTR): Measures the average time required to repair equipment after a failure.
- Planned Maintenance Percentage: Measures the percentage of maintenance activities that are planned or scheduled in advance.
- Overall Maintenance Cost: Measures the total cost associated with maintenance activities, including labor, parts, and downtime.
These metrics help assess the reliability, availability, and cost-effectiveness of maintenance practices within an organization.
Why Track Manufacturing KPIs?

Measure and analyze manufacturing KPIs with Frontier’s Performance Measurement and Reporting Tools.
Tracking manufacturing KPIs is essential for several reasons. Performance metrics play a crucial role in assessing the effectiveness and efficiency of manufacturing operations. They provide quantifiable data on production processes, comparing outputs to inputs such as labor, materials, and time. By analyzing these metrics, businesses can identify areas of strength, as well as pinpoint problem areas within their operations.
Manufacturing KPIs serve the following purposes:
- Quantifying Efficiency: Performance measurement reports enable businesses to quantify how effectively resources are utilized in the manufacturing process. This includes assessing the productivity of labor, the efficiency of material usage, and the optimization of time.
- Identifying Areas for Improvement: By highlighting areas that are not performing well or are inefficient, manufacturing KPIs help businesses prioritize improvements. Whether it’s reducing downtime, minimizing defects, or optimizing throughput, these metrics provide valuable insights for targeted enhancements.
- Optimizing Resource Allocation: Understanding where resources are most effectively utilized is critical for optimizing resource allocation. By analyzing KPIs, businesses can make informed decisions about staffing levels, material procurement, and equipment investments to maximize efficiency and minimize costs.
- Driving Continuous Improvement: Manufacturing KPIs serve as benchmarks for ongoing improvement initiatives. By setting measurable targets, businesses can track progress over time and drive continuous improvement efforts across the organization.
- Enhancing Decision-Making: Data-driven decision-making is crucial in today’s competitive manufacturing landscape. KPIs provide decision-makers with actionable insights into operational performance. This enables them to make informed decisions that drive strategic outcomes.
- Aligning with Business Objectives: Manufacturing KPIs should align with broader business objectives and strategic goals. By tracking metrics that directly impact overall performance and profitability, businesses can ensure that their manufacturing efforts are contributing effectively to the company’s success.
By tracking these manufacturing KPIs, you can gain a comprehensive understanding of your manufacturing operations and drive toward greater efficiency, competitiveness, and success.
Tracking and Reporting Issues
Despite their importance, performance reports are not without their challenges. Many manufacturing organizations struggle with inaccurate or incomplete data, outdated measurement methodologies, and disparate systems that hinder the ability to analyze data. Furthermore, the dynamic nature of manufacturing environments complicates the interpretation of productivity metrics. These come in the form of fluctuations in demand, supply chain disruptions, and unforeseen events that skew performance indicators.
Overcoming the Challenges
To overcome these challenges and measure manufacturing KPIs with confidence, organizations must adopt robust solutions. Using RF readers and smart manufacturing platforms can improve data accuracy and detail, making investments in advanced data collection technologies beneficial. Implementing integrated ERP systems enables real-time data sharing across departments, facilitating holistic performance analysis and reporting capabilities.

Frontier’s performance, tracking, and reporting tools help manufacturers break down their metrics for better business efficiency.
The Frontier ERP Advantage
At Friedman, we understand the critical importance of measuring manufacturing KPIs accurately and confidently. From real-time data to demand forecasting, we empower custom manufacturers to harness the full potential of their data with Frontier ERP. Our comprehensive suite of advanced analytics and reporting tools and industry expertise enables manufacturers to unlock actionable insights, driving operational excellence and sustainable growth.
We offer a seamless integration with Qlik for deeper analytics and also accommodate ODBC-compliant applications to further enrich your data.
Frontier RF Reporting
Using barcoding or RFID, our RF reporting tool automatically generates Frontier ERP reports on material and personnel activity, work steps, and transactions. It enables detailed tracking and analytics of stock and customer-specified products within one centralized system that supports:
- Purchase Receipts
- Purchase Returns
- Product Movement
- Physical Inventory
- Cycle Count
- Production Reporting
- Production Operation Reporting
- Truck Loading and Validation
- Product Consolidation / Skid Pack
Conclusion
In today’s competitive manufacturing landscape, success hinges on the ability to measure and manage KPIs with confidence. By establishing and monitoring your manufacturing KPIs, your company can stay competitive and succeed in a changing market. With the Frontier ERP suite and the right strategies in place, manufacturers can navigate complexity with clarity, driving efficiency, innovation, and profitability.
Frontier ERP includes a suite of built-in and customizable reports ready to use from day one. Our open architecture also allows you to bring in third-party data from any ODBC-compliant application to enhance your analytics. Let our dedicated team of experts show you a demo today!