In today’s volatile market, lumber companies face unprecedented challenges. Between shifting demand, rising logistics costs, and the ever-changing trade war, staying competitive requires more than just managing operations. It demands precision, foresight, and adaptability. And that starts with tracking the right supply chain metrics.
From timber harvesters and sawmills to engineered wood product companies and distributors, every business in the lumber industry feels the ripple effects of global events and domestic policy shifts. Chief among these is the ongoing tariff tug-of-war between the U.S. and Canada, significantly influencing lumber pricing and trade volumes.
Tariffs, Legislation, and Lumber Prices
Since 2017, the U.S. has imposed tariffs on Canadian softwood lumber under claims of unfair subsidies. While the tariff rate has fluctuated over the years, it has increased to 14.54%. The NAHB anticipates the rate to go even higher later this year. In a recent article, they stated that Canada accounts for roughly 85% of all U.S. softwood lumber imports and nearly a quarter of the available supply in the U.S.
Wood tariffs ripple across every sector that depends on wood and timber, driving up expenses for businesses and consumers alike and sometimes constraining supply. The effects are felt in:
- Lumber and Sawmill Operations
Tariffs inflate the cost of imported logs and timber, squeezing profit margins and, in severe cases, forcing smaller operators out of the market. - Construction
With lumber costs climbing, builders see material budgets swell, ultimately raising the price of new homes, renovations, and infrastructure projects.
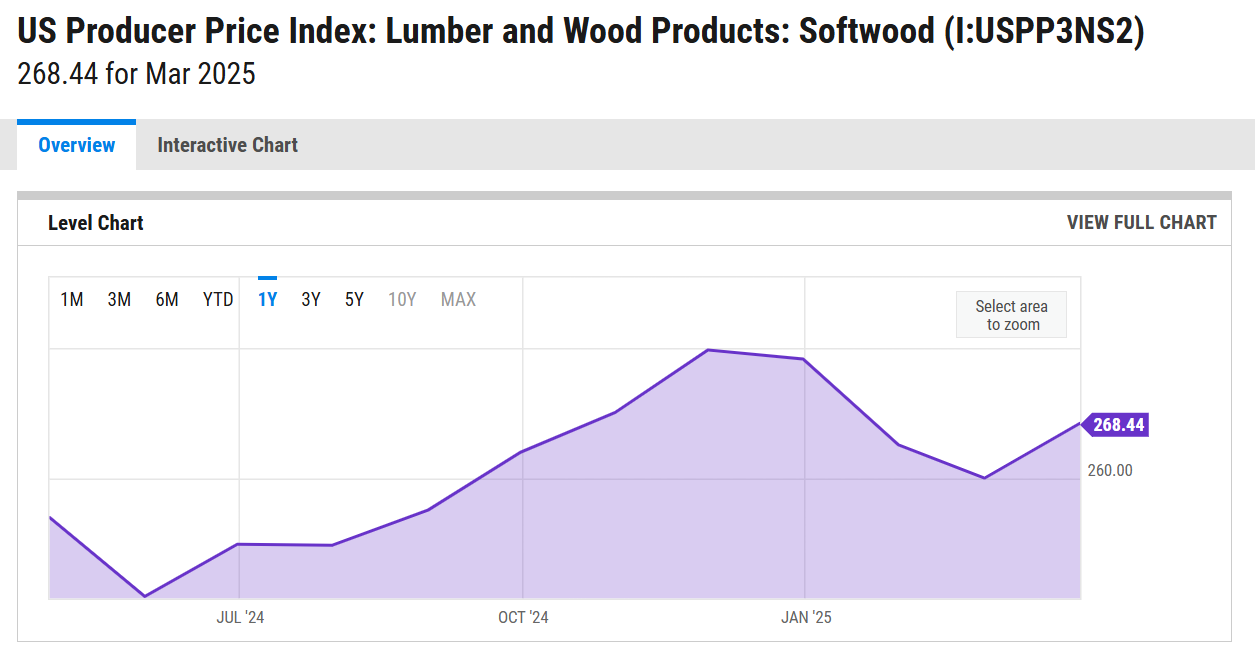
Source: ycharts.com
- Furniture Manufacturing
Producers who source hardwoods or softwoods from abroad confront steeper input costs, which often translate into higher retail prices for chairs, tables, and cabinets. - Paper and Pulp Production
Taxes on wood pulp and related raw materials increase the cost base for paper mills, potentially leading to reduced output or costlier paper products on store shelves. - Homebuilding
As one of the largest consumers of lumber, homebuilders directly pass tariff-driven price hikes onto buyers, making new homes less affordable. - Timber Harvesting and Transportation
Higher interest rates and diminished export markets, exacerbated by tariffs, tighten cash flow for loggers and haulers, threatening long-term viability. - Industrial Wood Products
Manufacturers of pallets, crates, and other industrial-grade wood goods face both rising costs and the risk of supply bottlenecks. - Retail Lumber Dealers
Dealers are left juggling uncertain pricing and spotty inventory, struggling to offer stable prices when their own supply costs are in flux.
Each of these players depends on real-time operational insights to make cost-effective decisions. That’s where supply chain metrics—and the software to track them—come into play.
Renewed Pacific NW Legislation Push
A bipartisan bill entitled the Mass Timber Federal Buildings Act was introduced in 2024 to promote the use of U.S. timber in construction. It has recently seen a renewed effort for passage by the introductory Senators. The bill presents a two-tier preference for mass timber and innovative wood projects that will create jobs across the Pacific NW. The first tier favors U.S.-made, responsibly sourced mass timber.
The optional second tier supports products from forest restoration, fire mitigation, or underserved forest owners. The bill also requires a whole building lifecycle assessment report.
Statistics on US Lumber Prices Over Time
According to the U.S. Bureau of Labor Statistics, the Producer Price Index (PPI) for softwood lumber saw a peak increase of 400% during the 2021 housing boom, before stabilizing somewhat in 2023. As of March 2025, the U.S. Producer Price Index for softwood lumber and wood products stands at 268.44—up from 260.10 in February (a 3.21% increase) and from 238.49 in March of last year (a 12.56% rise). Prices remain 30-50% above pre-2020 averages, largely due to continued tariff effects, supply disruptions, and labor shortages.
This pricing instability underscores the need for stronger supply chain visibility software, especially for businesses on both sides of the border.
Why Supply Chain Metrics Matter in the Lumber Industry
Supply chain metrics offer vital insights that help businesses anticipate problems before they spiral. When tariffs, transportation costs, and material availability fluctuate rapidly, tracking performance data is no longer optional.
The Role of Supply Chain Visibility Software
 The Role of Supply Chain Visibility Software
Modern supply chain visibility software centralizes data from purchasing, inventory, shipping, and production, enabling businesses to make quick, data-driven decisions. By doing so, it provides transparency across the chain and helps in managing fluctuations caused by tariffs, demand, or raw material shortages.
Advanced ERP systems with supply chain visibility software enable:
-
Real-time tracking of inventory and production levels
-
Automatic alerts for shipment delays or quality issues
-
Predictive analytics for smarter procurement
In the lumber industry, this means reducing waste, increasing yields, and better managing costs across multiple facilities.
The 10 Must-Track Lumber Industry Supply Chain Metrics
1. Inventory Turnover Ratio
This metric shows how frequently inventory is sold and replenished over a specific period, such as monthly or annually. A high turnover rate often indicates strong sales and efficient inventory management. Conversely, a low turnover may suggest overstocking, slow-moving products, or poor demand forecasting.
2. Order Fulfillment Cycle Time
Order Fulfillment Cycle Time measures the duration from when a customer places an order to when it’s delivered. Shorter cycle times signal efficient order processing and strong coordination between departments. Improving this metric can boost customer satisfaction and competitiveness in the market.
3. On-Time Delivery Rate
This KPI tracks the percentage of orders delivered to customers on or before the promised date. A high on-time delivery rate helps build trust and encourages repeat business. Frequent late deliveries can erode customer confidence and jeopardize long-term contracts.
4. Transportation Cost per Mile
Transportation Cost per Mile evaluates the cost-effectiveness of your shipping operations by analyzing the expense incurred for each mile traveled. This metric becomes especially important with rising fuel costs, labor shortages, and cross-border shipping delays. Monitoring it helps optimize route planning, fleet utilization, and carrier negotiations.
5. Demand Forecast Accuracy
Demand Forecast Accuracy assesses how closely your predicted sales align with actual customer orders. Accurate forecasting reduces the risks of stockouts, excess inventory, and production inefficiencies. It’s a vital metric for aligning operations with real-world demand.
6. Supplier Lead Time
Supplier Lead Time measures the average time it takes for suppliers to deliver raw materials or components after an order is placed. Reliable lead times are essential for planning and scheduling production efficiently. Delays can disrupt operations and increase costs due to expedited shipping or lost sales.
7. Return Rate and Reasons

This metric tracks the percentage of products returned and the reasons behind each return, such as damage, defects, or incorrect specifications. For wood and lumber manufacturers, high return rates may indicate deeper problems with product quality, handling, or communication with customers. Addressing return causes can lead to improved processes and reduced waste.
8. Production Downtime
Production Downtime refers to periods when machines or manufacturing processes are not operational. Tracking downtime and its causes, such as maintenance, equipment failure, or staffing issues, can help identify areas for improvement. Reducing downtime leads to greater productivity and better return on equipment investment.
9. Capacity Utilization
This metric indicates how much of your total manufacturing capacity is being used at a given time. High utilization suggests efficient use of resources, while low utilization may point to underused equipment, weak demand, or planning inefficiencies. Monitoring this helps manufacturers make decisions about scaling operations or reallocating resources.
10. Carbon Footprint per Shipment
Carbon Footprint per Shipment measures the environmental impact of delivering goods, including emissions from transportation and packaging. With increasing regulatory and consumer focus on sustainability, this metric is crucial for demonstrating environmental responsibility. Reducing your footprint not only supports green initiatives but can also uncover cost-saving opportunities.
How Supply Chain KPIs Drive Strategic Decisions
Real-Time Decision-Making and Forecasting
By monitoring KPIs consistently, companies can adapt quickly to market shifts. For example, if demand spikes unexpectedly due to a housing boom, real-time metrics can inform decisions on overtime, supplier engagement, and distribution adjustments.
Mitigating Risk from Tariff Volatility
When tariff hikes threaten profit margins, businesses can pivot by switching suppliers, stockpiling inventory, rerouting shipments, and renegotiating terms. However, this is only possible if their supply chain visibility software provides accurate, up-to-date insights.
Benefits of Supply Chain Visibility Software
Enhanced Data Collection and Integration
Modern tools eliminate spreadsheets and disconnected systems. They provide:
-
Central dashboards
-
Alerts on lead time deviations
-
Integrated procurement and inventory modules
Predictive Analytics and Efficiency Gains
ERP advanced reporting and analytics, and machine learning capabilities allow systems to forecast demand, predict delays, and automate reorder points. This helps maintain service levels while reducing overhead.
Frontier ERP Supply Chain Visibility Software for the Lumber Industry
Frontier ERP brings your entire operation into one interface, from procurement to shipping. It’s specifically designed for manufacturing-intensive industries that rely on lumber, like windows, doors, cabinets, furniture, and construction.
Frontier’s supply chain visibility software provides real‑time insight and end‑to‑end transparency across all stages of your logistics network. Key benefits include:
Improved Demand Forecasting: By collecting and analyzing data from suppliers, production, warehousing, and transportation, visibility tools help you predict demand more accurately, reducing stockouts and excess inventory.

Faster Issue Resolution: When shipments are delayed, damaged, or misrouted, you can instantly see where the problem lies and take corrective action, minimizing downtime and customer dissatisfaction.
Enhanced Collaboration: Shared dashboards and alerts allow suppliers, carriers, and internal teams to work from the same data set. This breaks down silos, speeds decision‑making, and fosters better relationships across your network.
Reduced Costs: Visibility into every leg of the journey helps you identify inefficiencies, whether it’s overpaying for expedited freight, underutilizing warehouse space, or choosing suboptimal shipping routes. Addressing these issues drives measurable cost savings.
Risk Mitigation: With real‑time tracking of geopolitical events, weather, and carrier performance, you can proactively reroute shipments or shift sourcing to avoid disruptions, protecting your production schedules and customer commitments.
Regulatory Compliance: Visibility platforms often include automated documentation and audit trails, making it easier to comply with trade regulations, customs requirements, and sustainability reporting mandates.
Sustainability Tracking: By monitoring carbon emissions across transportation modes and manufacturing operations, you can set reduction targets, identify high‑impact areas, and report on environmental performance.
Better Customer Experience: Providing end customers and sales teams with accurate, real‑time ETAs builds trust and reduces inbound status inquiries, freeing up your service reps to focus on higher‑value tasks.
Data‑Driven Continuous Improvement
Analytics and reporting turn raw tracking data into actionable KPIs (on‑time delivery, dwell time, order cycle time, etc.), enabling you to benchmark performance, run root‑cause analyses, and implement process improvements.
Scalability and Agility
As your business grows or market conditions shift, Frontier’s Supply Chain Management scales with you, onboarding new suppliers, adding modes of transport, or entering new regions without a major IT overhaul.
Together, these benefits not only streamline operations and cut costs but also support strategic initiatives. By giving you the confidence that comes from true end‑to‑end visibility, entering new markets or committing to sustainability goals becomes easier.
Take Control of Your Supply Chain Today
As the lumber market evolves and tariffs continue to influence prices and profitability, the companies that thrive will be those who embrace data-driven decision-making. Tracking key supply chain metrics with the help of supply chain visibility software isn’t just smart—it’s essential.
Frontier ERP helps you bring everything into view, simplify your operations, and build a more resilient, profitable future. Don’t just react to change, get ahead of it with our supply chain visibility software features. Would you like more information? Let us know today or see us at AWFS® Fair 2025 in July!


FAQs About Lumber Supply Chain Metrics and ERP Software
1. Why do tariffs matter in the lumber supply chain?
Tariffs increase the landed cost of goods, reduce competitiveness, and affect supplier relationships, especially for cross-border trade.
2. How can I reduce transportation costs in my lumber business?
Use metrics like transportation cost per mile, optimize loads, and leverage routing algorithms from visibility software.
3. Is it hard to switch from spreadsheets to ERP software?
Not with Frontier ERP. The platform supports fast implementation and onboarding, even for legacy data systems.
4. What metric is most important for sawmills?
Inventory turnover and capacity utilization are critical for mill efficiency and meeting fluctuating demand.
5. How often should I review supply chain KPIs?
Weekly or monthly reviews are ideal, depending on order volume and market volatility.
6. Is Frontier ERP scalable for small lumber businesses?
Absolutely. It’s modular, so you can start small and scale as needed.